
亞洲領先的金融企業
擁抱創新和人才,為客戶、員工、股東和社會
提供永續的金融解決方案
提供永續的金融解決方案
藉由我們的創業精神與創新能力,成為亞洲領先的金融企業
我們的核心價值
我們集合最佳人才,打造永續金融藍圖。我們勇於創新,持續落實透明溝通、穩健治理與社會回饋。

使命
擁抱創新和人才,為客戶、員工、股東和社會,提供永續的金融解決方案。
願景
藉由我們的創業精神與創新能力,成為亞洲領先的金融企業。
價值
以客戶為中心、值得信賴、創業家精神、協同合作。
多元領域,攜手為您


一步一腳印,我們堅實的里程碑
凱基金控(原中華開發金控)成立於 2001 年,集合各為業界翹楚的五大子公司,為您提供高整合、全領域創新金融服務。
2024
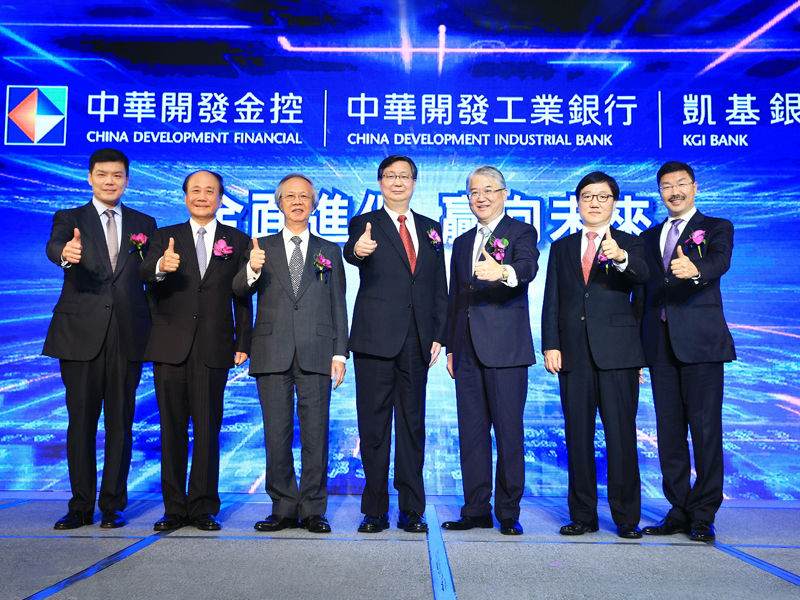
2024年10月9日,中華開發金控正式更名為凱基金控
以ONE KGI策略積極整合集團資源與服務,打造全方位金融服務,展現永續經營承諾。
2024
2024 年 1 月 1 日,中國人壽正式更名為凱基人壽
以「致力於您的幸福人生」做為企業價值主張,凱基人壽邁開嶄新步伐,全心實現永續經營目標,成為最受推薦和信賴的壽險公司。
2023
2023 年 7 月,凱基投信成為凱基金控子公司
凱基投信經股權移轉,成為凱基金控(原中華開發金控)全資持股子公司。我們逐步整合壽險、銀行、證券、投信、私募股權/資產管理五大事業體系,深耕台灣,佈局全球。
2021
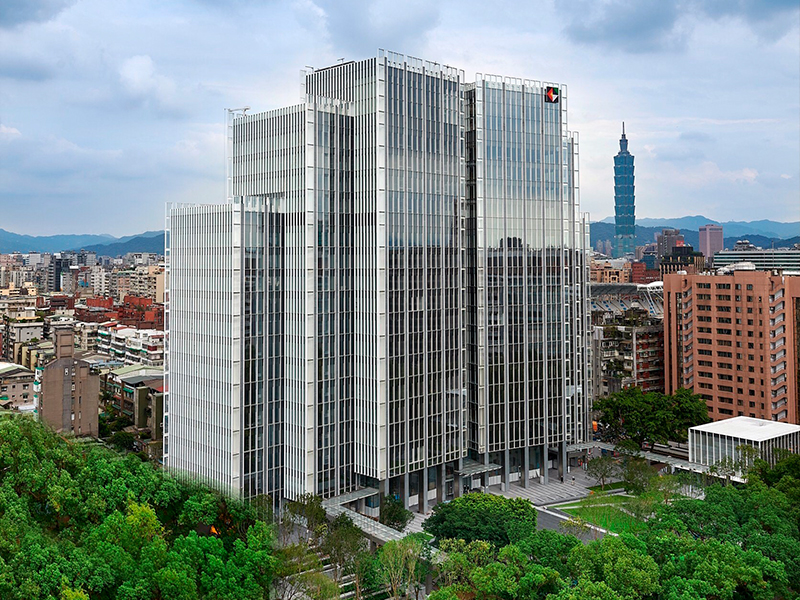
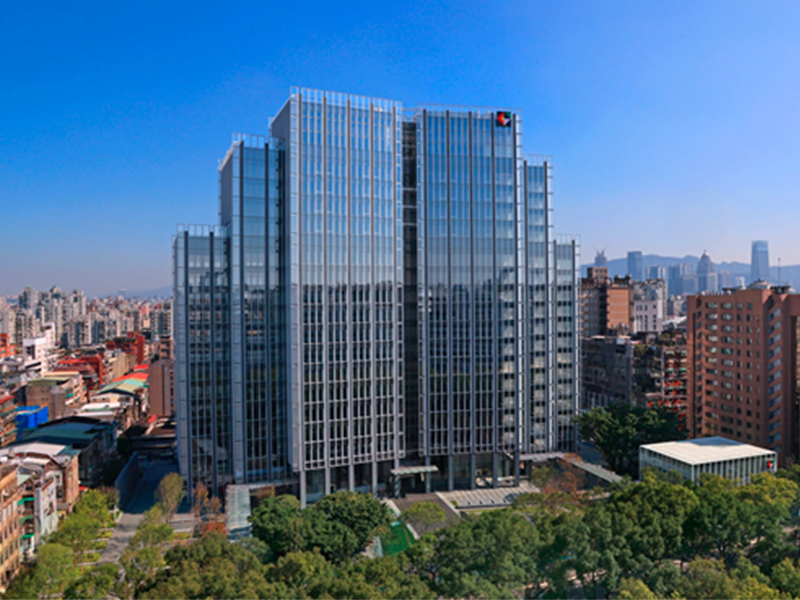
2021 年 10 月,凱基金控(原中華開發金控)全新總部落成啟用
時逢集團成立 20 周年,我們位於敦化北路的全新總部正式落成啟用。羽翼造型的新大樓,象徵即將展翅高飛,以創業精神與創新能力,成為亞洲領先的金融企業。
2021
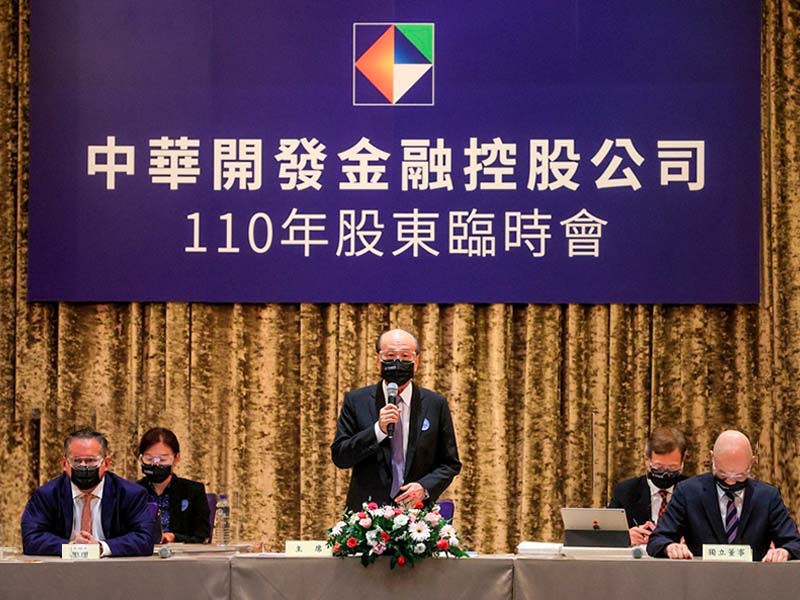
2021 年 10 月,取得凱基人壽(原中國人壽)流通在外全部股權
股東會通過以股份轉換方式,將凱基人壽(原中國人壽)納為 100% 持股之子公司,加速我們在銀行、證券、私募股權、資產管理和保險領域的整合佈局,強化集團競爭力並發揮經營綜效。
2021
2021 年 4 月,我們承諾 2045 年淨零碳排目標
世界各國、機構與企業面對氣候危機,攜手達成共識,致力減碳並逐步邁向淨零目標。我們認為金融業可透過投、融資行為擴大影響力,領先同業承諾 2045 年全資產組合淨零碳排。
2017
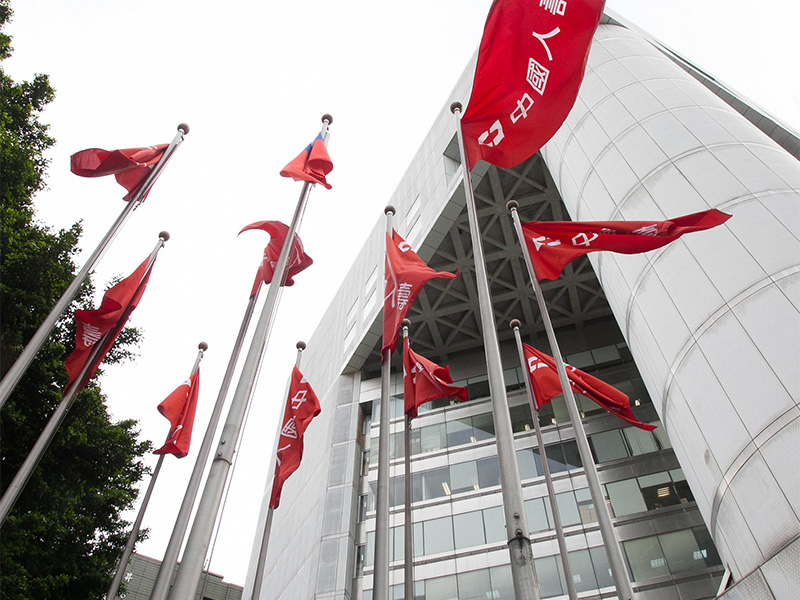
2017 年 9 月,中國人壽加入我們服務行列
我們公開收購中國人壽 25.33% 股權,成為中國人壽第一大股東,逐步建立更多元的金融服務版圖。
2017
2017 年 3 月,中華開發工業銀行改制,更名為中華開發資本
延續工業銀行的競爭優勢與服務精神,中華開發資本致力於私募股權投資基金,積極拓展資產管理業務。
2015
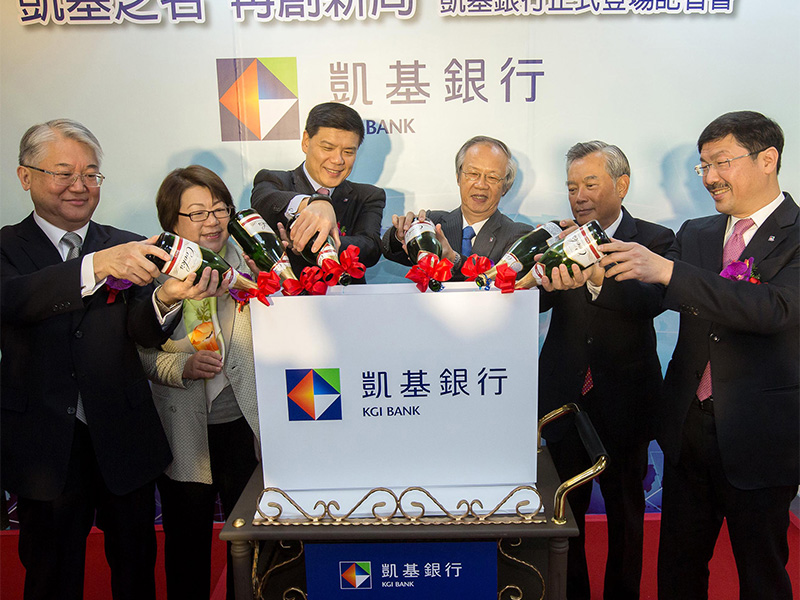
2015 年 1 月,萬泰銀行正式更名為凱基銀行
凱基銀行以全新氣象立穩市場,同年 5 月 1 日,中華開發工業銀行以營業讓與方式,將企業金融和其他金融業務移轉至凱基銀行。
2014
2014 年 9 月,萬泰銀行正式成為子公司
擁有優良信譽和營運歷史的萬泰銀行,正式加入我們成為子公司,以嶄新形象邁向新局。
2013
2013 年 6 月,凱基證券與子公司大華證券正式合併
我們完成旗下兩大券商業務整合,大步向前成為國內投資銀行、債券及新金融商品領導者。
2001
2001 年 12 月 28 日,凱基金融控股股份有限公司(原中華開發金控)有限公司正式成立
我們於 6 月 20 日以股份轉換方式設立,經主管機關核准後,於 12 月 28 日正式成立,同日起於台灣證券交易所掛牌上市。
1999
中華開發信託股份有限公司改制為工業銀行
改制之後,中華開發工業銀行持續落實原來的重要角色,為台灣產業與經濟發展奉獻心力。
1959
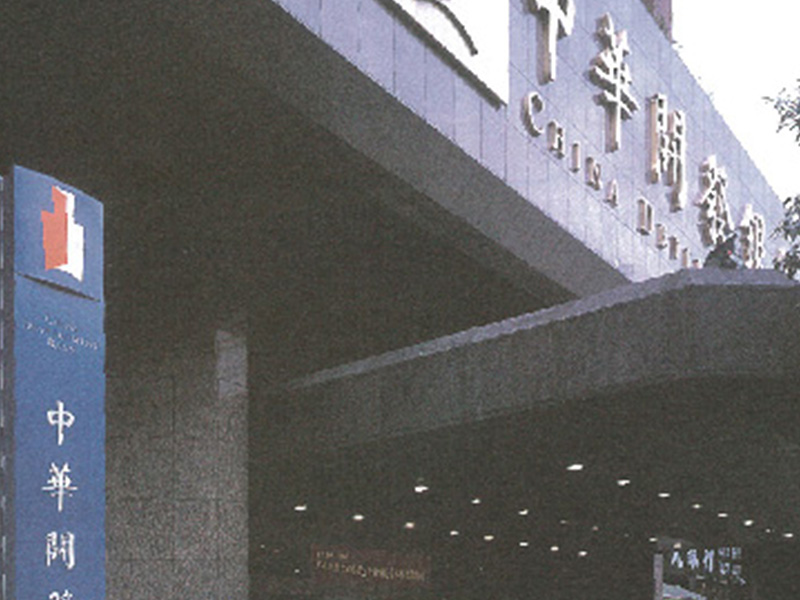
中華開發信託股份有限公司正式成立
由行政院經濟安定委員會和世界銀行聯合推動,我們是台灣第一家民營開發性金融機構。
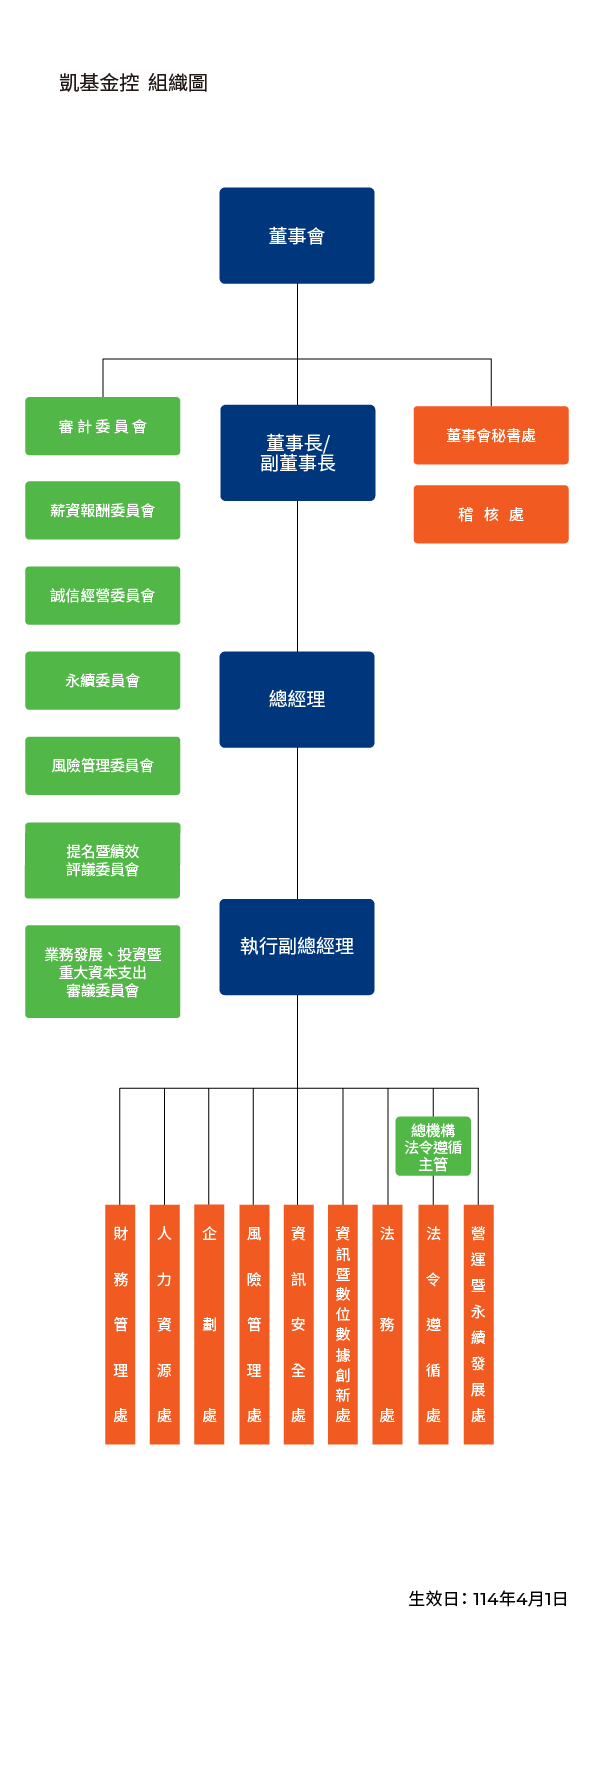
我們的組織架構
穩健的企業治理,是邁向永續發展並獲得投資信任的最佳途徑。
一覽我們的組織架構